Back
25 Feb 2020
USD/INR New York Price Forecast: Dollar easing from February highs vs. rupee
- USD/INR remains trapped in a sideways market.
- Bears are likely eyeing the 71.60 and 71.20 levels on the way down.
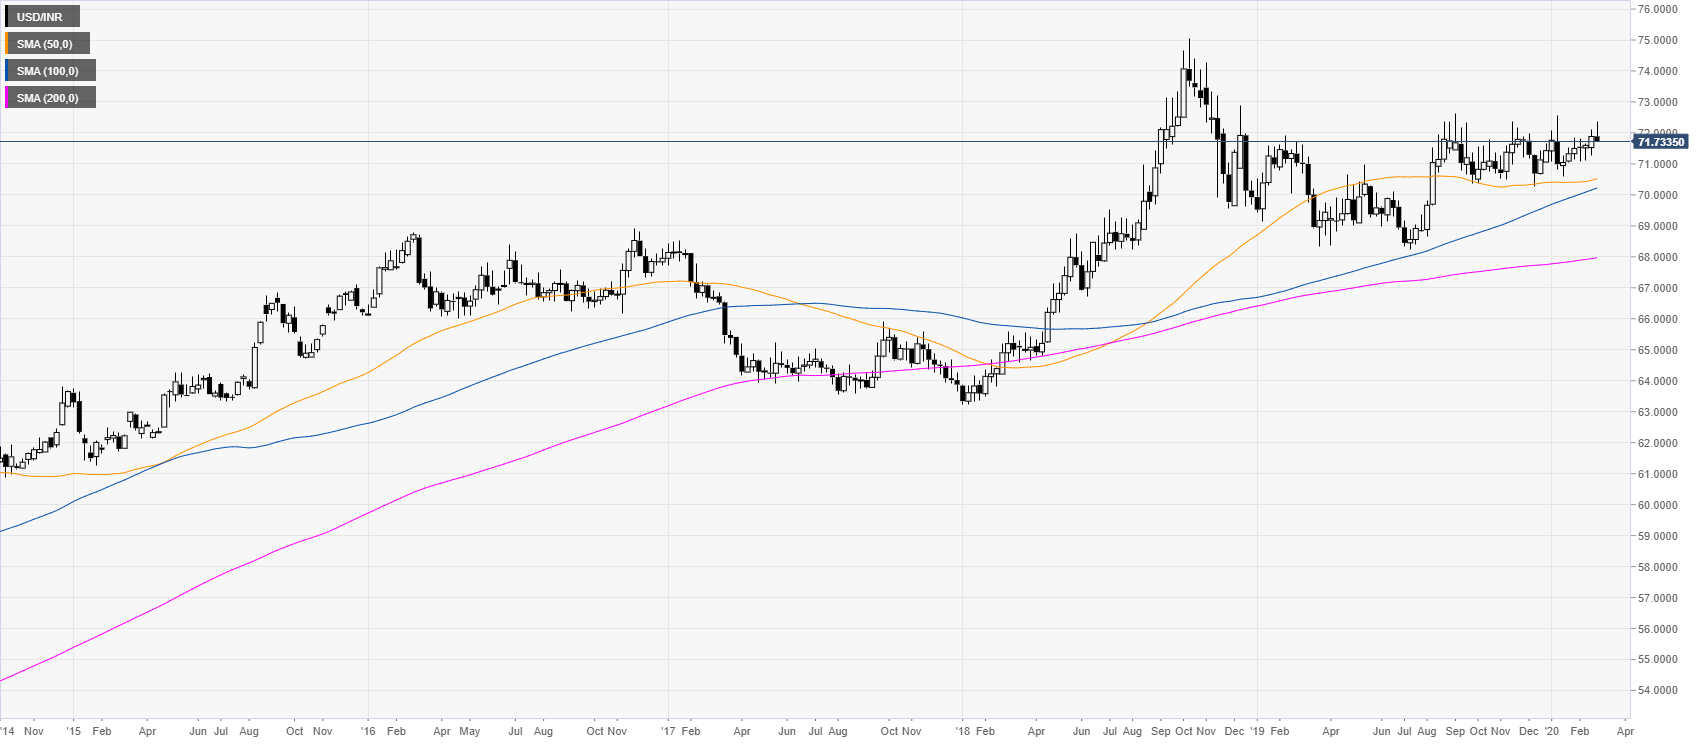
USD/INR weekly chart
After the 2018 bull-market, USD/INR has been consolidating in a rectangle formation. The quote is trading above its main weekly simple moving averages (SMAs), suggesting a bullish momentum in the long term.
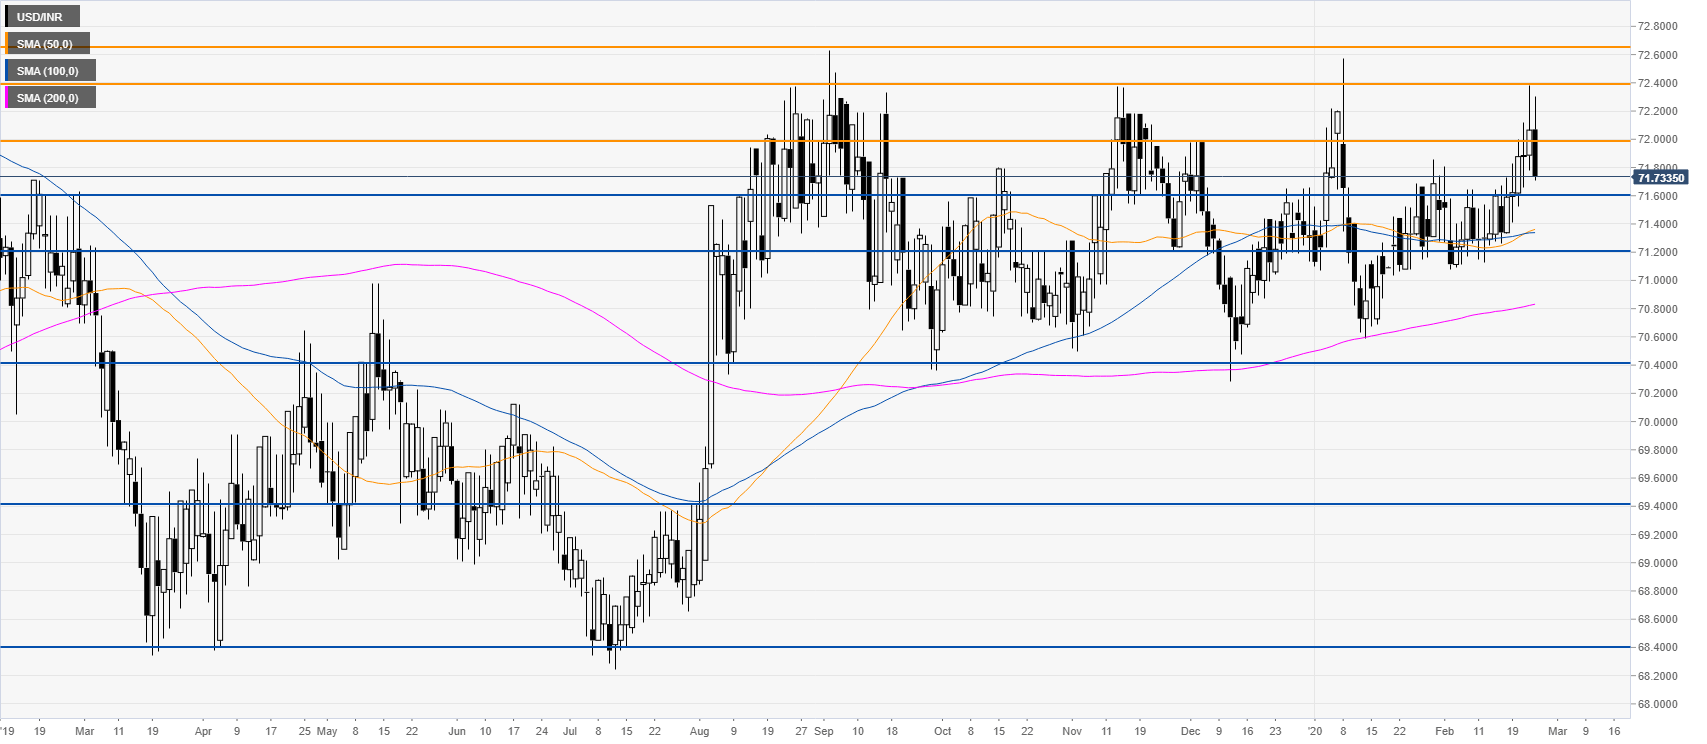
USD/INR daily chart
The spot is erasing Monday’s gains while retracing from the February high. The market seems trapped in a range suggesting a potential decline towards 71.60 and 71.20 levels in the medium term.
Additional key levels